x <- pi
amp <- 2
freq <- 0.5

y <- amp * sin(freq * x)
y
[1] 2This set of exercises is not fully ready and will be improved over the next few days. Do at your own risk ;)
This sheet contains an exercise where you can apply and deepen the skills from E002 to E004. The end goal is to be able to plot different Sine curves that differ in amplitude, frequency and offset.
To begin, we need a function that calculates the sine.
Hint: implement at least these parameters, if you like you can also add offsets.
x <- pi
amp <- 2
freq <- 0.5
y <- amp * sin(freq * x)
y[1] 2Your function now should do this
calc_sin(x = pi, amp = 2, freq = 0.5)[1] 2and it should also work with a vector
Hint: sequences you learned in E004
x <- seq(from = 0, to = 4 * pi, by = pi / 4)
y <- calc_sin(x = x, amp = 2, freq = 0.5)
y
[1] 0.000000e+00 7.653669e-01 1.414214e+00 1.847759e+00 2.000000e+00
[6] 1.847759e+00 1.414214e+00 7.653669e-01 2.449294e-16 -7.653669e-01
[11] -1.414214e+00 -1.847759e+00 -2.000000e+00 -1.847759e+00 -1.414214e+00
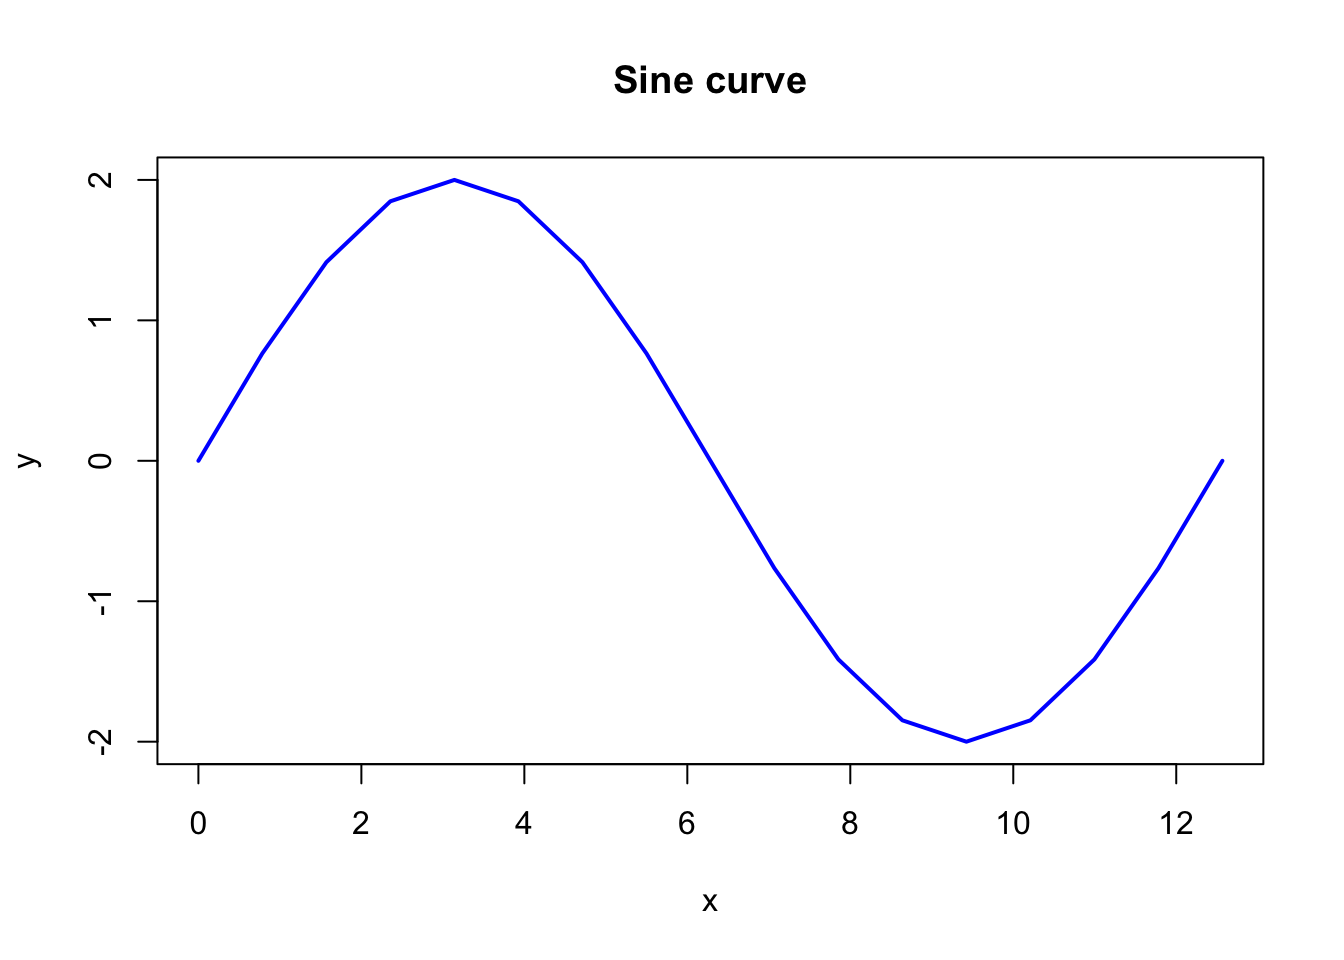
[16] -7.653669e-01 -4.898587e-16Since the previous result is not easy to verify, let’s create a plot of these results.
plot(x, y,
  type = "l", col = "blue", lwd = 2,
  xlab = "x", ylab = "y", main = "Sine curve"
)
You are already familiar with functions that return text or numbers. In R, however, it is also possible to write functions that generates directly plots.
plot_sin <- function(x, GAP) {
  y <- GAP # calc_sin
  title <- GAP
  return(plot(x, y, GAP))
}
You should got a function which does something like that
Hint: Use “E002”-skills for customizing your title
x <- seq(from = 0, to = 4 * pi, by = pi / 25)
plot_sin(x = x, amp = 2, freq = 1, color = "green")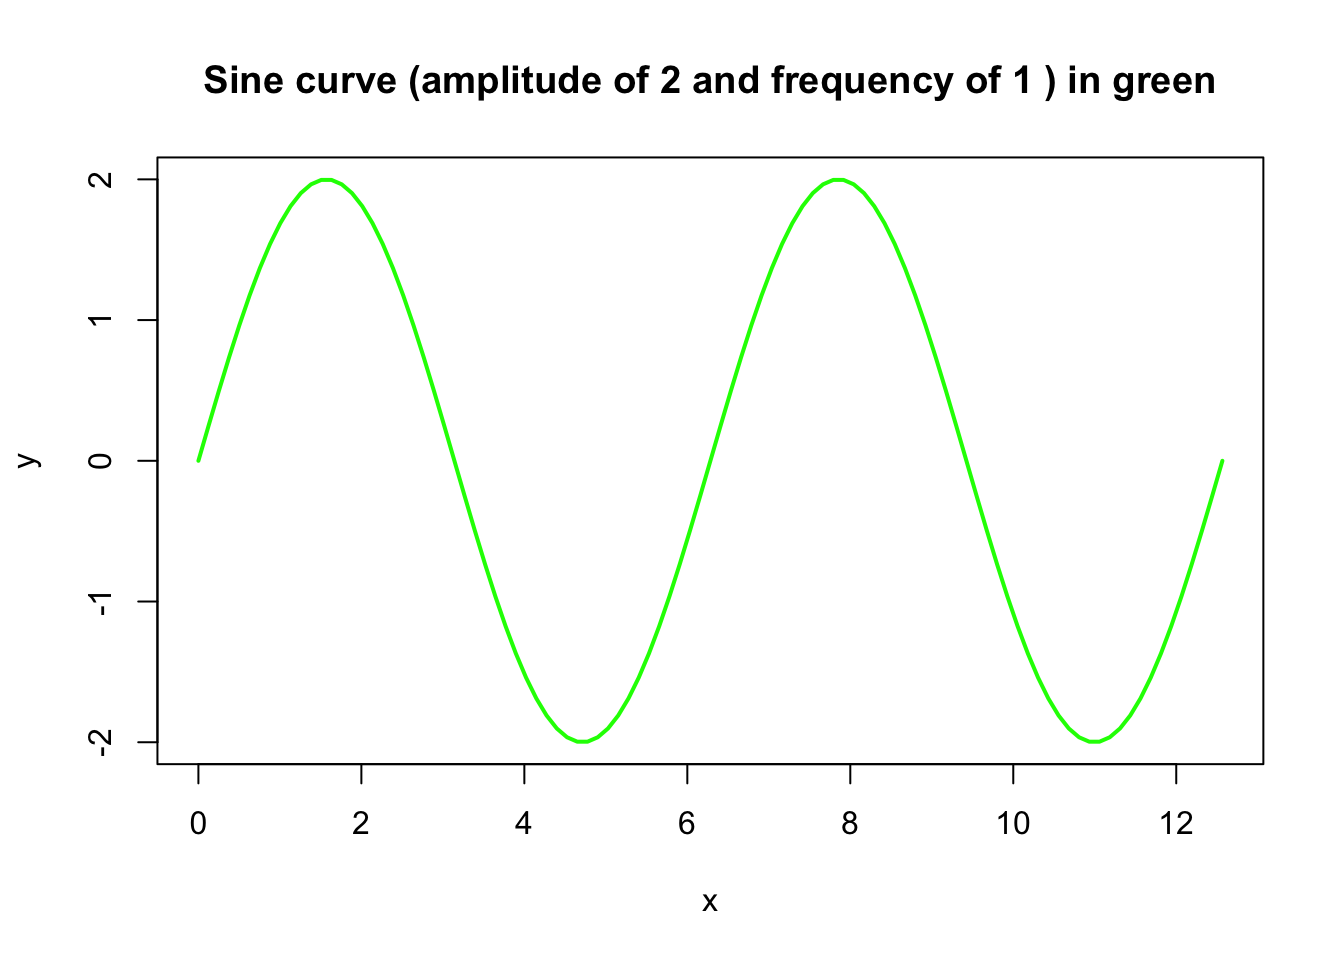
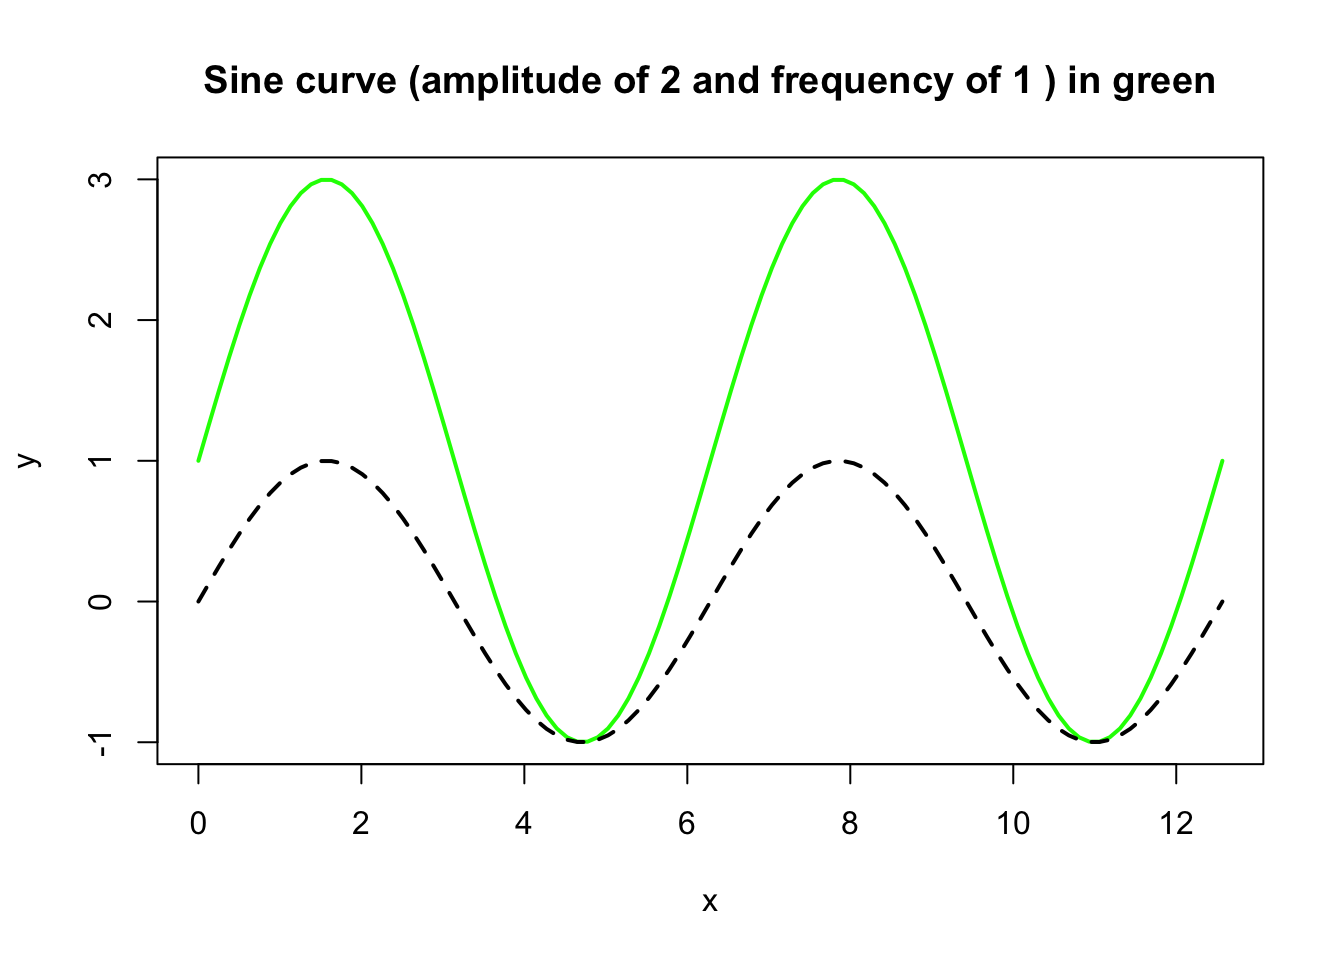
Once the basic building blocks are in place, it becomes easier to add further enhancements. Here, for example, is a reference curve added.
plot_sin_rev(x = x, amp = 2, freq = 2, color = "green")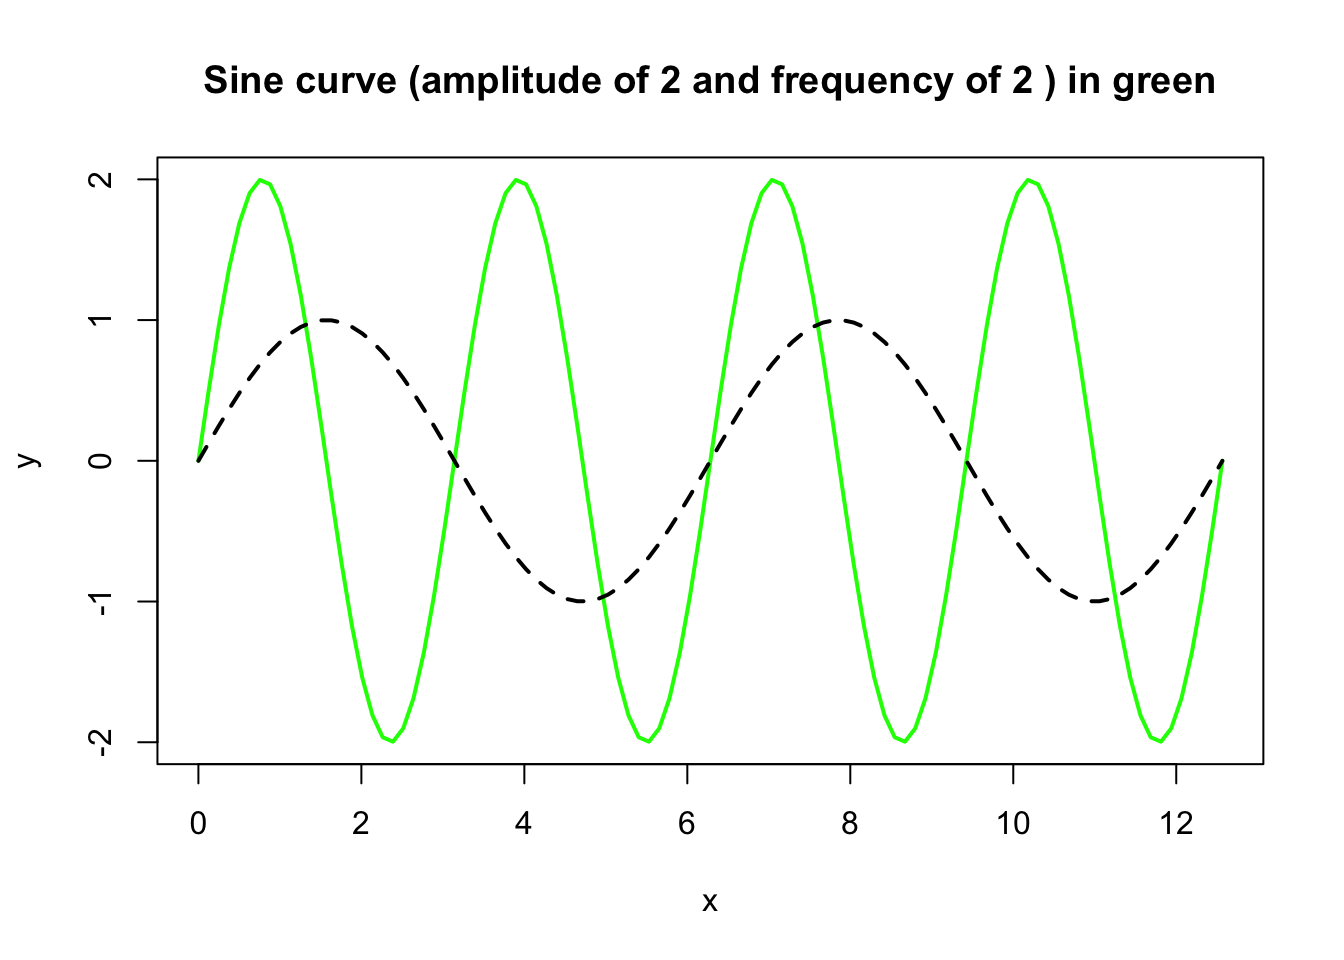
plot_sin_rev(x = x, amp = 2, freq = 1, yoffset = 1, color = "green")