This set of exercises is not fully ready and will be improved over the next few days. Do at your own risk ;)
Programming exercise
These exercises should help you write faster, more efficient code. So this exercises are inspired by both your LOGO code and mine (https://hubiatgit.github.io/Starting_Github/LOGO/LOGO_Hubi.html ).
Goal: Improve the performance of the code below by creating more efficient functions.
Data frame for testing the speed
<- data.frame (angle = seq (0 , 360 , 0.1 ))$ x <- 5 * cos (hist$ angle / 180 * pi )$ y <- 5 * sin (hist$ angle / 180 * pi )$ color <- sample (colors (), size = nrow (hist), replace = TRUE )$ color[sample (1 : 50 , 1 )] <- "red" head (hist)
  angle        x           y          color
1   0.0 5.000000 0.000000000     royalblue1
2   0.1 4.999992 0.008726642 darkslategray3
3   0.2 4.999970 0.017453257           peru
4   0.3 4.999931 0.026179819     blueviolet
5   0.4 4.999878 0.034906301         grey59
6   0.5 4.999810 0.043632677         green3
1. Constants
Doing things only ones if possible, means pre calculate often used numbers.
<- function (x, y, hist) {<- hist$ x[[length (hist$ x)]] + 2 / 3 * cos (hist$ angle[nrow (hist)] * (pi / 180 ))<- hist$ y[[length (hist$ y)]] + 2 / 3 * sin (hist$ angle[nrow (hist)] * (pi / 180 ))return (c (new_x, new_y))new_pos (10 , 3 , hist)
[1] 5.666667e+00 -1.387933e-15
Speed-test:
:: mark (slow = new_pos (10 , 3 , hist),fast = new_pos_fast (10 , 3 , hist)
# A tibble: 2 × 6
  expression      min   median `itr/sec` mem_alloc `gc/sec`
  <bch:expr> <bch:tm> <bch:tm>     <dbl> <bch:byt>    <dbl>
1 slow         3.81µs   4.39µs   208221.        0B     41.7
2 fast         2.17µs   2.62µs   330353.    56.4KB     66.1
2. Early returns
Stop searching as soon as you’ve found what you’re looking for. This idea can also be applied to a series of if-statements.
<- function (hist) {<- 1 <- c () while (i <= nrow (hist)) {if (hist$ color[i] == "red" ) {<- c (res, i)<- i + 1 return (max (min (res),0 ))find_first_red (hist)
Speed-test:
:: mark (slow = find_first_red (hist),fast = find_first_red_fast (hist)
# A tibble: 2 × 6
  expression      min   median `itr/sec` mem_alloc `gc/sec`
  <bch:expr> <bch:tm> <bch:tm>     <dbl> <bch:byt>    <dbl>
1 slow         4.71ms   4.97ms      199.        0B     81.6
2 fast        11.11µs  12.67µs    74714.    33.1KB     59.8
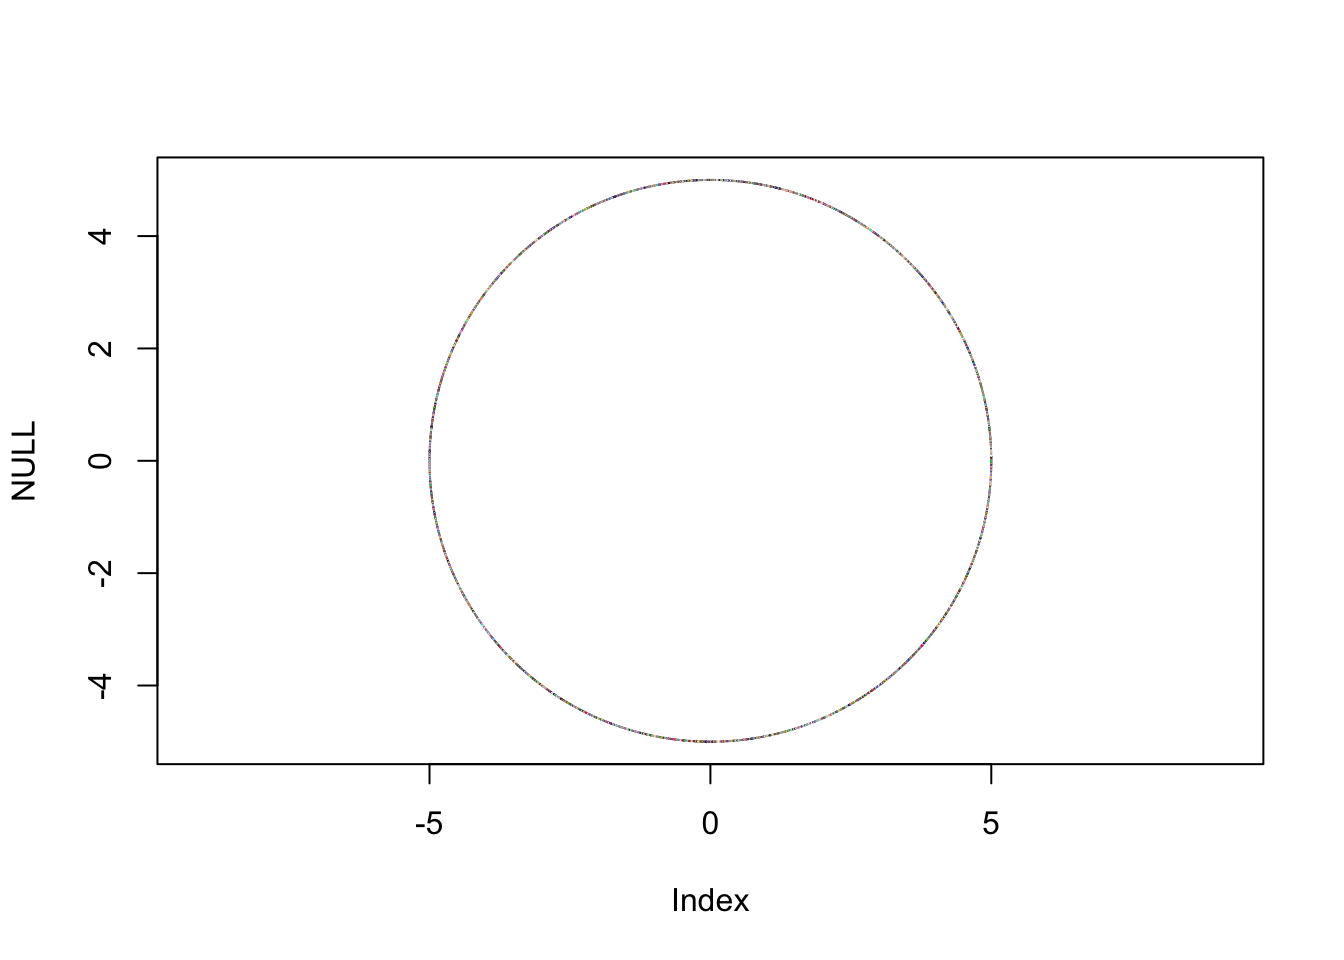
3. Omit Loops
Almost all functions in R can handle vector inputs. This means that loops aren’t truly avoided, but they are executed at the much faster underlying machine level.
<- function (hist) {plot (NULL ,xlim = range (hist$ x), ylim = range (hist$ y), asp = 1 )for (i in 2 : nrow (hist)) {segments (x0 = hist$ x[i - 1 ], y0 = hist$ y[i - 1 ],x1 = hist$ x[i], y1 = hist$ y[i],col = hist$ color[i])replot_hist (hist)
Speed-test:
:: mark (slow = replot_hist (hist),fast = replot_hist_fast (hist)
Warning: Some expressions had a GC in every iteration; so filtering is
disabled.
# A tibble: 2 × 6
  expression      min   median `itr/sec` mem_alloc `gc/sec`
  <bch:expr> <bch:tm> <bch:tm>     <dbl> <bch:byt>    <dbl>
1 slow         72.7ms   82.5ms      10.5     159KB     24.5
2 fast         24.8ms   26.2ms      37.3     639KB      0
4. Growing objects
Last but in my code possibly the worst: appending rows to an existing list or data frame using append(), c(old, new), or even rbind().
<- function (x, y , hist) {<- hist$ angle[length (hist$ angle)]<- hist$ color[length (hist$ color)]<- data.frame (angle = last_angle,x = x,y = y,color = last_color<- rbind (hist, new_row)tail (add_line (3 ,10 ,hist))
     angle        x             y           color
3597 359.6 4.999878 -3.490630e-02 mediumturquoise
3598 359.7 4.999931 -2.617982e-02         orange1
3599 359.8 4.999970 -1.745326e-02          grey59
3600 359.9 4.999992 -8.726642e-03          grey38
3601 360.0 5.000000 -1.224647e-15    springgreen3
3602 360.0 3.000000  1.000000e+01    springgreen3
Speed-test:
:: mark (slow = add_line (3 , 10 , hist),fast = add_line_fast (3 , 10 , hist)
# A tibble: 2 × 6
  expression      min   median `itr/sec` mem_alloc `gc/sec`
  <bch:expr> <bch:tm> <bch:tm>     <dbl> <bch:byt>    <dbl>
1 slow        176.8µs  225.4µs     4214.     318KB     22.7
2 fast         65.2µs   89.4µs    11037.     333KB     63.8
5. Logo
Now try to make your own Logo code faster. To begin, you might want to start by profiling your code, as described here: https://adv-r.hadley.nz/perf-measure.html
For this, you’ll need a plain R script, which you can create like this:
library (profvis)library (bench)library (knitr)# convert your file to a R Script purl ("LOGO/LOGO_Hubi.qmd" , output = "LOGO/LOGO_profiling.R" )# loading this file as a source source ("LOGO/LOGO_profiling.R" )# then run your logo inside profvis() profvis (run_LOGO ("CS SP [-pi/5] [-Sin(PI/2)/2] sPc [black] REPEAT 20 [RepeaT 180 [FD 1 RT 2] RT 18] SPEED 100 Home SpC [gREEN] StC [blue] REPEaT 20.1 [rEPEAT 180 [fD 1 RT 2] RT 18] UndoChunk CS REPEAT 150 [ FD [n * 2] RT 91 ] SPEED 1 saVe [Logo04]" ))